I’ve been experimenting with building a waveguide antenna for ads-b reception, and while it’s been a fun project, it’s also been frustrating. It seems that some of the popular online antenna calculators are intended for only wifi frequencies around 2.4mhz, and even though they accept the input of frequencies in other bands, some of the resulting output appears to be incorrect. In fairness, the calculators are presented in the context of building a wifi antenna and don’t claim to be suitable for other frequencies, however I’m fairly certain that I’m not the only one to incorrectly assume that they could be used for other, non-wifi, frequencies.
The problem appears to be with the calculation of the guide wavelength, which ultimately affects the distance of the probe from the enclosed end of the tube.
Based on available materials, I decided to build a ‘can’ antenna 196mm in diameter and 447mm in length. Anticipating that my metalworking ‘precision’ might necessitate some provision for adjustment, I built a movable probe and started testing.
Using the popular calculator at https://www.changpuak.ch/electronics/cantenna.php, and entering the frequency (1090 mhz) and diameter (196mm) the distance from the closed end to the probe was given as 33.0725mm, and the guide wavelength was given as 132.29mm.
On the first attempt, I built a probe adjustment range of 20-90mm from the enclosed end. While the antenna DID receive signals using those dimensions, the results were far less sensitive and much less directional than I expected.
Reading on other sites (linked below) convinced me that guide wavelength is always longer than freespace wavelength, and since freespace wavelength at 1090mhz is around 275mm, the 132mm guide wavelength and 33mm probe position must have been incorrect. Later testing of the calculator showed that regardless of the frequency entered, for any given can-diameter the guide wavelength remained the same.
After building a second can with a 40-170mm adjustment range, and using an N1201SA impedance analyser (calibrated open, short, load) to check the S11 return loss and vswr, the best results were with the probe at about 122mm from the enclosed end of the can. With the addition of a couple of carefully placed tuning screws, vswr was 1.024 and s11 was -38.28, both of which seemed reasonable.
Recently, I mustered up the courage to work through the intimidating-looking formula to determine the guide wavelength and eventually, where the probe SHOULD be located. Using the formula from Microwaves 101, for a 196mm can, the guide wavelength is 483.46mm and distance from the probe to the closed end of the can is 120.87mm, pretty close to my 122mm.
The results to date have been more directional, but still with a lot of side and back lobe reception. Now that I have reasonable measurements, next up is to roll a new can and properly attach the enclosed end, and fine tune further.
The following calculator appears to handle more than just wifi frequencies. http://www.wikarekare.org/Antenna/WaveguideCan.html 2
References to guide wavelength.
https://www.microwaves101.com/encyclopedias/waveguide-mathematics
www.w1ghz.org/QEX/circular_wg.pdf 1
Thursday 14 February 2019
Tuesday 1 August 2017
July 2017 Rangeplot
from Planeplotter
 |
| click to enlarge |
and from Virtual Radar Server
 |
| click to enlarge |
July's results show some significant increases in most directions. The gain settings were the same as June's, but the distances were greater. Some of the increase can be explained by more aircraft at higher altitudes in more directions, however some was purely weather based.
During the month, there were several large storms that passed through Saskatchewan. I've noticed that during storms or in the early morning after a storm, when the air is very humid, my reception range expands. In some cases, whether by reflection, conduction, tropospheric ducting, or some other freak of nature, I've received aircraft at altitudes and distances that should be technically impossible. I'll add a separate post with more details.
During the month, there were several large storms that passed through Saskatchewan. I've noticed that during storms or in the early morning after a storm, when the air is very humid, my reception range expands. In some cases, whether by reflection, conduction, tropospheric ducting, or some other freak of nature, I've received aircraft at altitudes and distances that should be technically impossible. I'll add a separate post with more details.
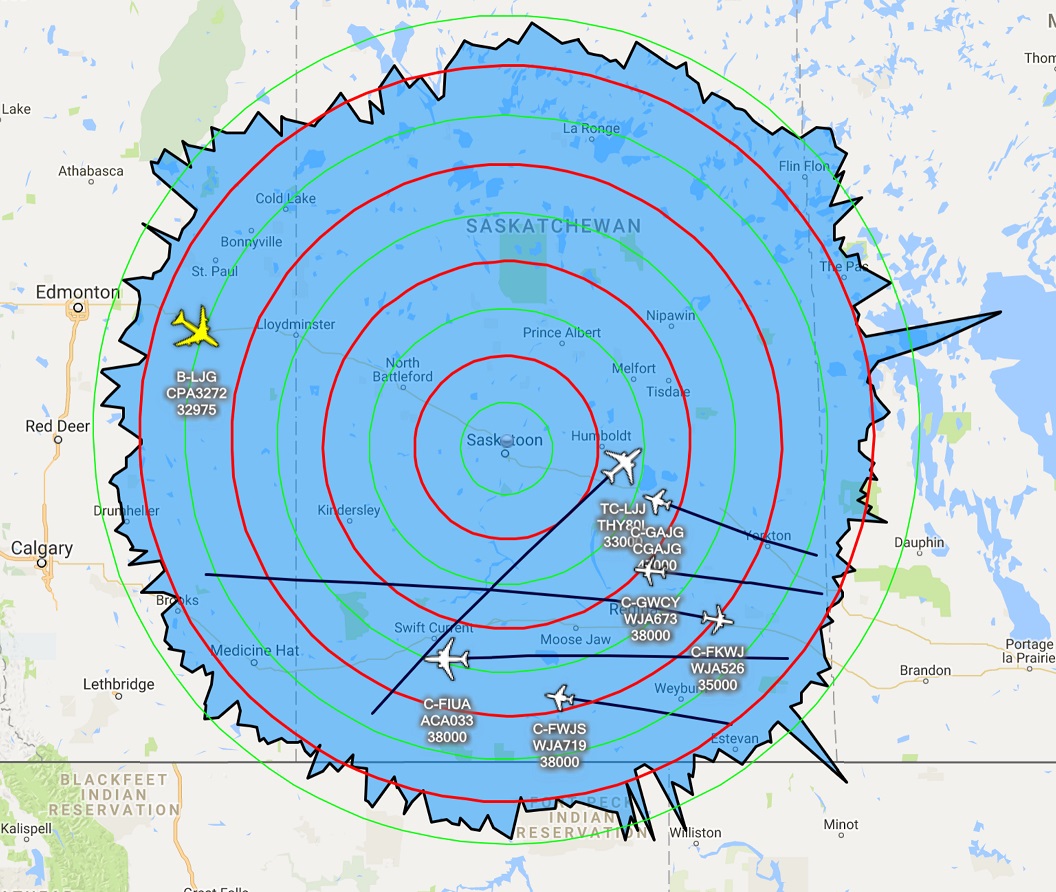
Live view of Saskatchewan skies
Courtesy of opensky-network.org. You can mouse-over each aircraft for additional details, and if you click on the Opensky logo, the link will take you to their website.
Tuesday 4 July 2017
June 2017 Rangeplot
from Planeplotter

(click to enlarge)
and from Virtual Radar Server

(click to enlarge)
The pattern of flights from month to month doesn't appear to change very much. They generally follow the same routes, however in June there were many more flights ranging from 450 to 500 flights per day. Sometimes the same aircraft can be seen multiple times in the same day, such as those that arrive from Europe early in the day, and then return in the evening.
Saturday 17 June 2017
May 2017 Rangeplot
from Planeplotter

(click to enlarge)
and from Virtual Radar Server

(click to enlarge)
In May, I started feeding to the Opensky Network, based in Switzerland. A joint project of two universities, they apparently are the only service that archives the tracks and makes them available for research purposes. As far as I can tell, we're the only Saskatchewan feeder.
The live view of Saskatchewan skies has been moved to the June Rangeplot posting.
The live view of Saskatchewan skies has been moved to the June Rangeplot posting.
Monday 1 May 2017
April 2017 Rangeplot
from Planeplotter

(click to enlarge)
and from Virtual Radar Server

(click to enlarge)
In April, summer flight schedules began, which brought some airlines that I haven't seen here before. The Polish airline LOT, has started regular service from Warsaw to Los Angeles several times per week and Austrian Airlines is serving Los Angeles from Vienna.
Boeing continues deliveries of their newest 737-800 aircraft, and many commercial airlines worldwide have ordered them. In April both Ryanair(Ireland) and Egypt Air took delivery of these brand new aircraft, and each of them flew over Saskatchewan. Ryanair has been flying direct from Boeing Field in Washington to Dublin, while Egyptair has been making a stop in Iceland before continuing on to Cairo.
It appears that the transponders in these aircraft are particularly strong - the two westernmost points on the rangeplot (south of Red Deer and south of Calgary) were both from new 737-800s being delivered.
Saturday 15 April 2017
March 2017 Rangeplot
from Planeplotter


(click to enlarge)
and from Virtual Radar Server
(click to enlarge)
At the beginning of March it was time to upgrade some of the software components used to track flights and generate these images. I upgraded Planeplotter and each instance of Dump1090-Mutability. Somehow I messed up the Planeplotter upgrade and not all of the background map tiles loaded, and at the same time, I managed to chop-off the top and bottom of the aircraft trails. With the restart at the beginning of April, the problem seems to be solved.
Spikes on the chart
Sometimes a garbled signal will be received from an aircraft and is decoded with an incorrect position. At other times, an aircraft may have a defect in its transponder that is causing it to occasionally transmit incorrect positions. These will often appear as random single spikes in the monthly chart on Virtual Radar Server, and as much as the software will try to apply some logic and filter them out, some of the false positions remain. Of course, if conditions are 'just right', a perfectly valid spike may appear, however after checking the logs, that large spike into Manitoba does not appear to be a valid one.
Saturday 1 April 2017
February 2017 Rangeplot
from Planeplotter

(click to enlarge)
and from Virtual Radar Server

(click to enlarge)
Occasionally, there will be brief times when atmospheric conditions are 'just right' and aircraft that would normally be out-of-range, can be received. For some reason that I'm not able to explain, this happens most frequently to the south-east, as can be seen in the plot from Virtual Radar Server. The red rings are 100 kilometers apart, so that would place this particular distance at well over 500 kilometers.
Outdoor temperatures during February ranged from +8C to -30C. During this month the core temperature of the OrangePi PC out on the roof varied from +25C to -4C and both it and the Flightaware ProStickPlus receiver connected to it continued to perform flawlessly.
Subscribe to:
Posts (Atom)